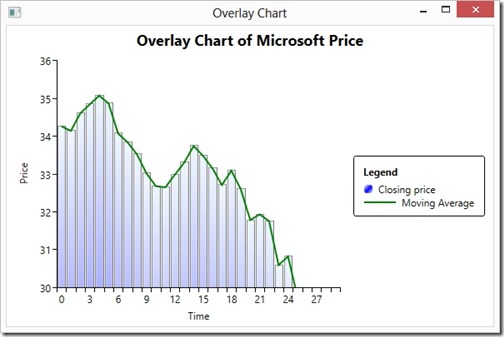
Sometimes we need to display more than one chart at a time on top of each other to get more information on it. It is specially true in finance where we are displaying lots of chats together to get a better idea about market. In fact there is a separate field in finance for this names “Technical Analysis”. We will study this in more detail in coming post, but as a first step we need to study the overlay chart and see how can we display the overlay chart.
In fact displaying more than one chart using mindscape is nothing different than displaying only one type of chart. Here we are taking an example of display the moving average and closing price of the Microsoft stock price. Our first step is to get the historical price of Microsoft. There are different ways of this, but we tried http://finance.yahoo.com. We downloaded the Microsoft historical price by typing this at internet browser.
http://ichart.finance.yahoo.com/table.csv?s=MSFT
This price download in one CVS file and we can easily read this CVS file using LINQ. We just removed the header of the CVS file to make my LINQ query simple. Our first step is to create a simple class to store this information.
{
public DateTime Date
{ get; set; }
public double Open
{ get; set; }
public double High
{ get; set; }
public double Low
{ get; set; }
public double Close
{ get; set; }
public int Volume
{ get; set; }
public double AdjClose
{ get; set; }
}
Here is a LINQ query to read the CVS file.
let tickerData = line.Split(',')
select new TickerData()
{
Date = Convert.ToDateTime(tickerData[0]),
Open = Convert.ToDouble(tickerData[1]),
High = Convert.ToDouble(tickerData[2]),
Low = Convert.ToDouble(tickerData[3]),
Close = Convert.ToDouble(tickerData[4]),
Volume = Convert.ToInt32(tickerData[5]),
AdjClose = Convert.ToDouble(tickerData[6])
}).ToList();
Now comes to the chart portion of it. In Mindscape we simply uses the different chart type one after another. In this example we are going to display a Line Series and Bar Series together.
Here is complete XAML of our program.
xmlns="http://schemas.microsoft.com/winfx/2006/xaml/presentation"
xmlns:x="http://schemas.microsoft.com/winfx/2006/xaml"
xmlns:ms="clr-namespace:Mindscape.WpfElements.Charting;assembly=Mindscape.WpfElements"
Title="Overlay Chart" Height="400" Width="600">
<Grid>
<ms:Chart Margin="5" Title="Overlay Chart of Microsoft Price">
<ms:Chart.XAxis>
<ms:ChartAxis Title="Time" MajorTickSpacing="1"/>
</ms:Chart.XAxis>
<ms:Chart.YAxis>
<ms:ChartAxis Title="Price" MajorTickSpacing="1" Minimum="30"/>
</ms:Chart.YAxis>
<ms:BarSeries ItemsSource="{Binding}"
YBinding="{Binding Price}" Title="Closing price">
<ms:BarSeries.SeriesBrush>
<LinearGradientBrush>
<GradientStop Color="AliceBlue" Offset="0"/>
<GradientStop Color="Blue" Offset="0.5"/>
<GradientStop Color="AliceBlue" Offset="1"/>
</LinearGradientBrush>
</ms:BarSeries.SeriesBrush>
</ms:BarSeries>
<ms:LineSeries ItemsSource="{Binding}"
SeriesBrush="Green"
YBinding="{Binding Price}" Title="Moving Average"/>
</ms:Chart>
</Grid>
</Window>
And here is complete C# code of our program.
using System.Collections.ObjectModel;
using System.IO;
using System.Linq;
using System.Windows;
namespace WpfOverlayChart
{
/// <summary>
/// Interaction logic for MainWindow.xaml
/// </summary>
public partial class MainWindow : Window
{
private ObservableCollection<ChartData> chartData = new ObservableCollection<ChartData>();
public MainWindow()
{
InitializeComponent();
string filename = @"C:\zamjad\Data\MSFT.csv";
var data = (from line in File.ReadAllLines(filename)
let tickerData = line.Split(',')
select new TickerData()
{
Date = Convert.ToDateTime(tickerData[0]),
Open = Convert.ToDouble(tickerData[1]),
High = Convert.ToDouble(tickerData[2]),
Low = Convert.ToDouble(tickerData[3]),
Close = Convert.ToDouble(tickerData[4]),
Volume = Convert.ToInt32(tickerData[5]),
AdjClose = Convert.ToDouble(tickerData[6])
}).ToList();
int count = chartData.Count;
for (int i = 0; i < 30; i++)
{
double sum = 0.0;
for (int j = 0; j < 10; j++)
{
sum += data[i + j].Close;
}
double sma = sum / 10;
chartData.Add(new ChartData() { Price = data[i].Close, SMA = sma });
}
DataContext = chartData;
}
}
public class ChartData
{
public double SMA
{ get; set; }
public double Price
{ get; set; }
}
public class TickerData
{
public DateTime Date
{ get; set; }
public double Open
{ get; set; }
public double High
{ get; set; }
public double Low
{ get; set; }
public double Close
{ get; set; }
public int Volume
{ get; set; }
public double AdjClose
{ get; set; }
}
}
This is an output of our program.


[…] Now the first step is to get the price data and perform these calculation. Here we are going to use the same technique we used while creating the overlay chart here. […]
By: Creating Bollinger Band using Mindscape | Zeeshan Amjad's WinRT, and WPF Blog on June 5, 2013
at 10:54 pm